I measured all of my 27 cubes using a dial caliper, and most of them fell along the lines of .75 inches. We measured all of the cubes to analyze the quality and determine the consistency of the cubes' sides. In order to create our final project, the completed puzzle cube, it was important that most of the cubes were close and consistent in measurements. If they weren't it may have affected the outcome in a negative way.
For these puzzle cubes, the acceptable dimensional limit was 95% based on past experiences. The acceptable range would have direct relationship to the Empirical Rule, which states that 68% of your data should fall within one standard deviation of the mean, 95% within two, and 99.7% within three. I calculated these percentages by adding the standard deviation and subtracting it from the mean. I added and subtracted it once for one standard deviation and twice for two (three wasn't needed).
For our brainstorming sketches, we created 20 different isometric drawings that had to be three by three, and they couldn't consist of more than six or less than four pieces. We made these sketches so that when we had to choose our final five, we had multiple variations to choose from.
Develop a Solution
It was important when doing our multi view sketches to properly dimension so that if someone where to attempt at recreating my cube, the pieces would fit together properly with the correct measurements.
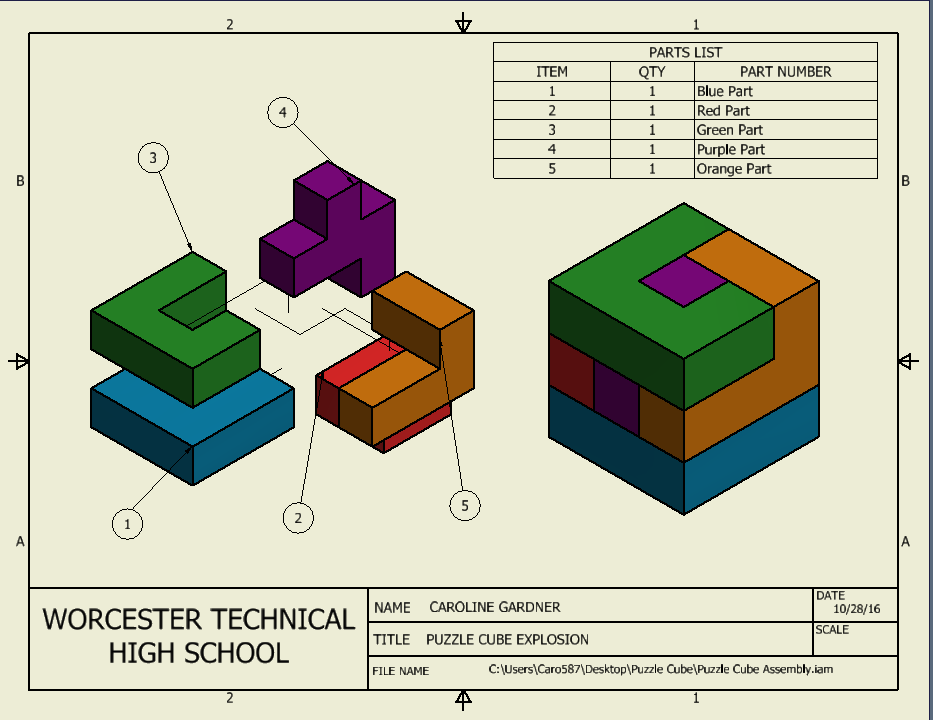
Construct and Test Prototype
The six degrees of freedom are that on the x-axis you can rotate and move left to right, on the y-axis you can rotate and move up and down, and on the z-axis you can also rotate and move left and right (almost diagonally because of its position). When assembling my final cube on Inventor, I used the degrees of freedom when constraining certain parts of my pieces, like determining where I had to flush or mate certain parts.
Evaluate the Solution
Time: Subject: 6:18 1 7:24 2 4:54 3 3:59 4 3:04 5
After reviewing and compiling my data, I decided that I wouldn't change anything in my puzzle cube design. I say this because my design was solved in a reasonable amount of time, and it was interesting and challenging for all who tried to solve it.
Present the Solution
This puzzle cube project was both interesting and challenging. It made me apply everything I had learned in this class at certain points throughout the project. I began to understand throughout the entire process why certain steps had to be done in a certain way. For example, when measured our wooden cubes we had to make sure they were all within the proper standard deviation. This was important because if certain cubes were out of the range or were an odd measurement, they may not have fit with other pieces to complete the final 3x3 cube. The definition of statistics is the collection, evaluation, and interpretation of data. I did all three of those items while measuring my cubes and calculating things like the mean. When it came time to use Inventor, I was completely new to the program, so honestly there would be times in which I was very confused. After working with the software more, I am now able to model things much more quickly and comprehend them more easily. Going back to my very first lesson in this class, the design process, I noticed how often it is used in projects like these. Every single portion of this project had some relevance to the design process. All in all, this project was fun and interesting for me to complete.